
Note
Go to the end to download the full example code
Standard Experimental Design (Grid Search)#
Author(s): Romain Egele.
This example demonstrates how to generate points from standard experimental designs (e.g., random, grid, lhs).
from deephyper.analysis._matplotlib import update_matplotlib_rc

update_matplotlib_rc()
First we define the hyperparameter search space.
from deephyper.problem import HpProblem


problem = HpProblem()
problem.add_hyperparameter((0.0001, 100.0, "log-uniform"), "x")
problem.add_hyperparameter((0.0, 100.0), "y")
problem.add_hyperparameter([1, 2, 3], "z")
problem
problem
Configuration space object:
  Hyperparameters:
    x, Type: UniformFloat, Range: [0.0001, 100.0], Default: 0.1, on log-scale
    y, Type: UniformFloat, Range: [0.0, 100.0], Default: 50.0
    z, Type: Ordinal, Sequence: {1, 2, 3}, Default: 1
Then we define the black-box function to optimize.
def run(job):
    config = job.parameters
    objective = config["x"] + config["y"]
    return objective
Then we define the search. In this example, we use the ExperimentalDesignSearch class to generate points from a grid design. The Evaluator can also be used with this class to parallelize evalutions. Note that n_points and max_evals take the same value here.
from deephyper.search.hps import ExperimentalDesignSearch


max_evals = 200
search = ExperimentalDesignSearch(problem, run, n_points=max_evals, design="grid")
results = search.search(max_evals)
WARNING:root:Results file already exists, it will be renamed to /Users/romainegele/Documents/Argonne/deephyper/examples/results_20240326-172239.csv
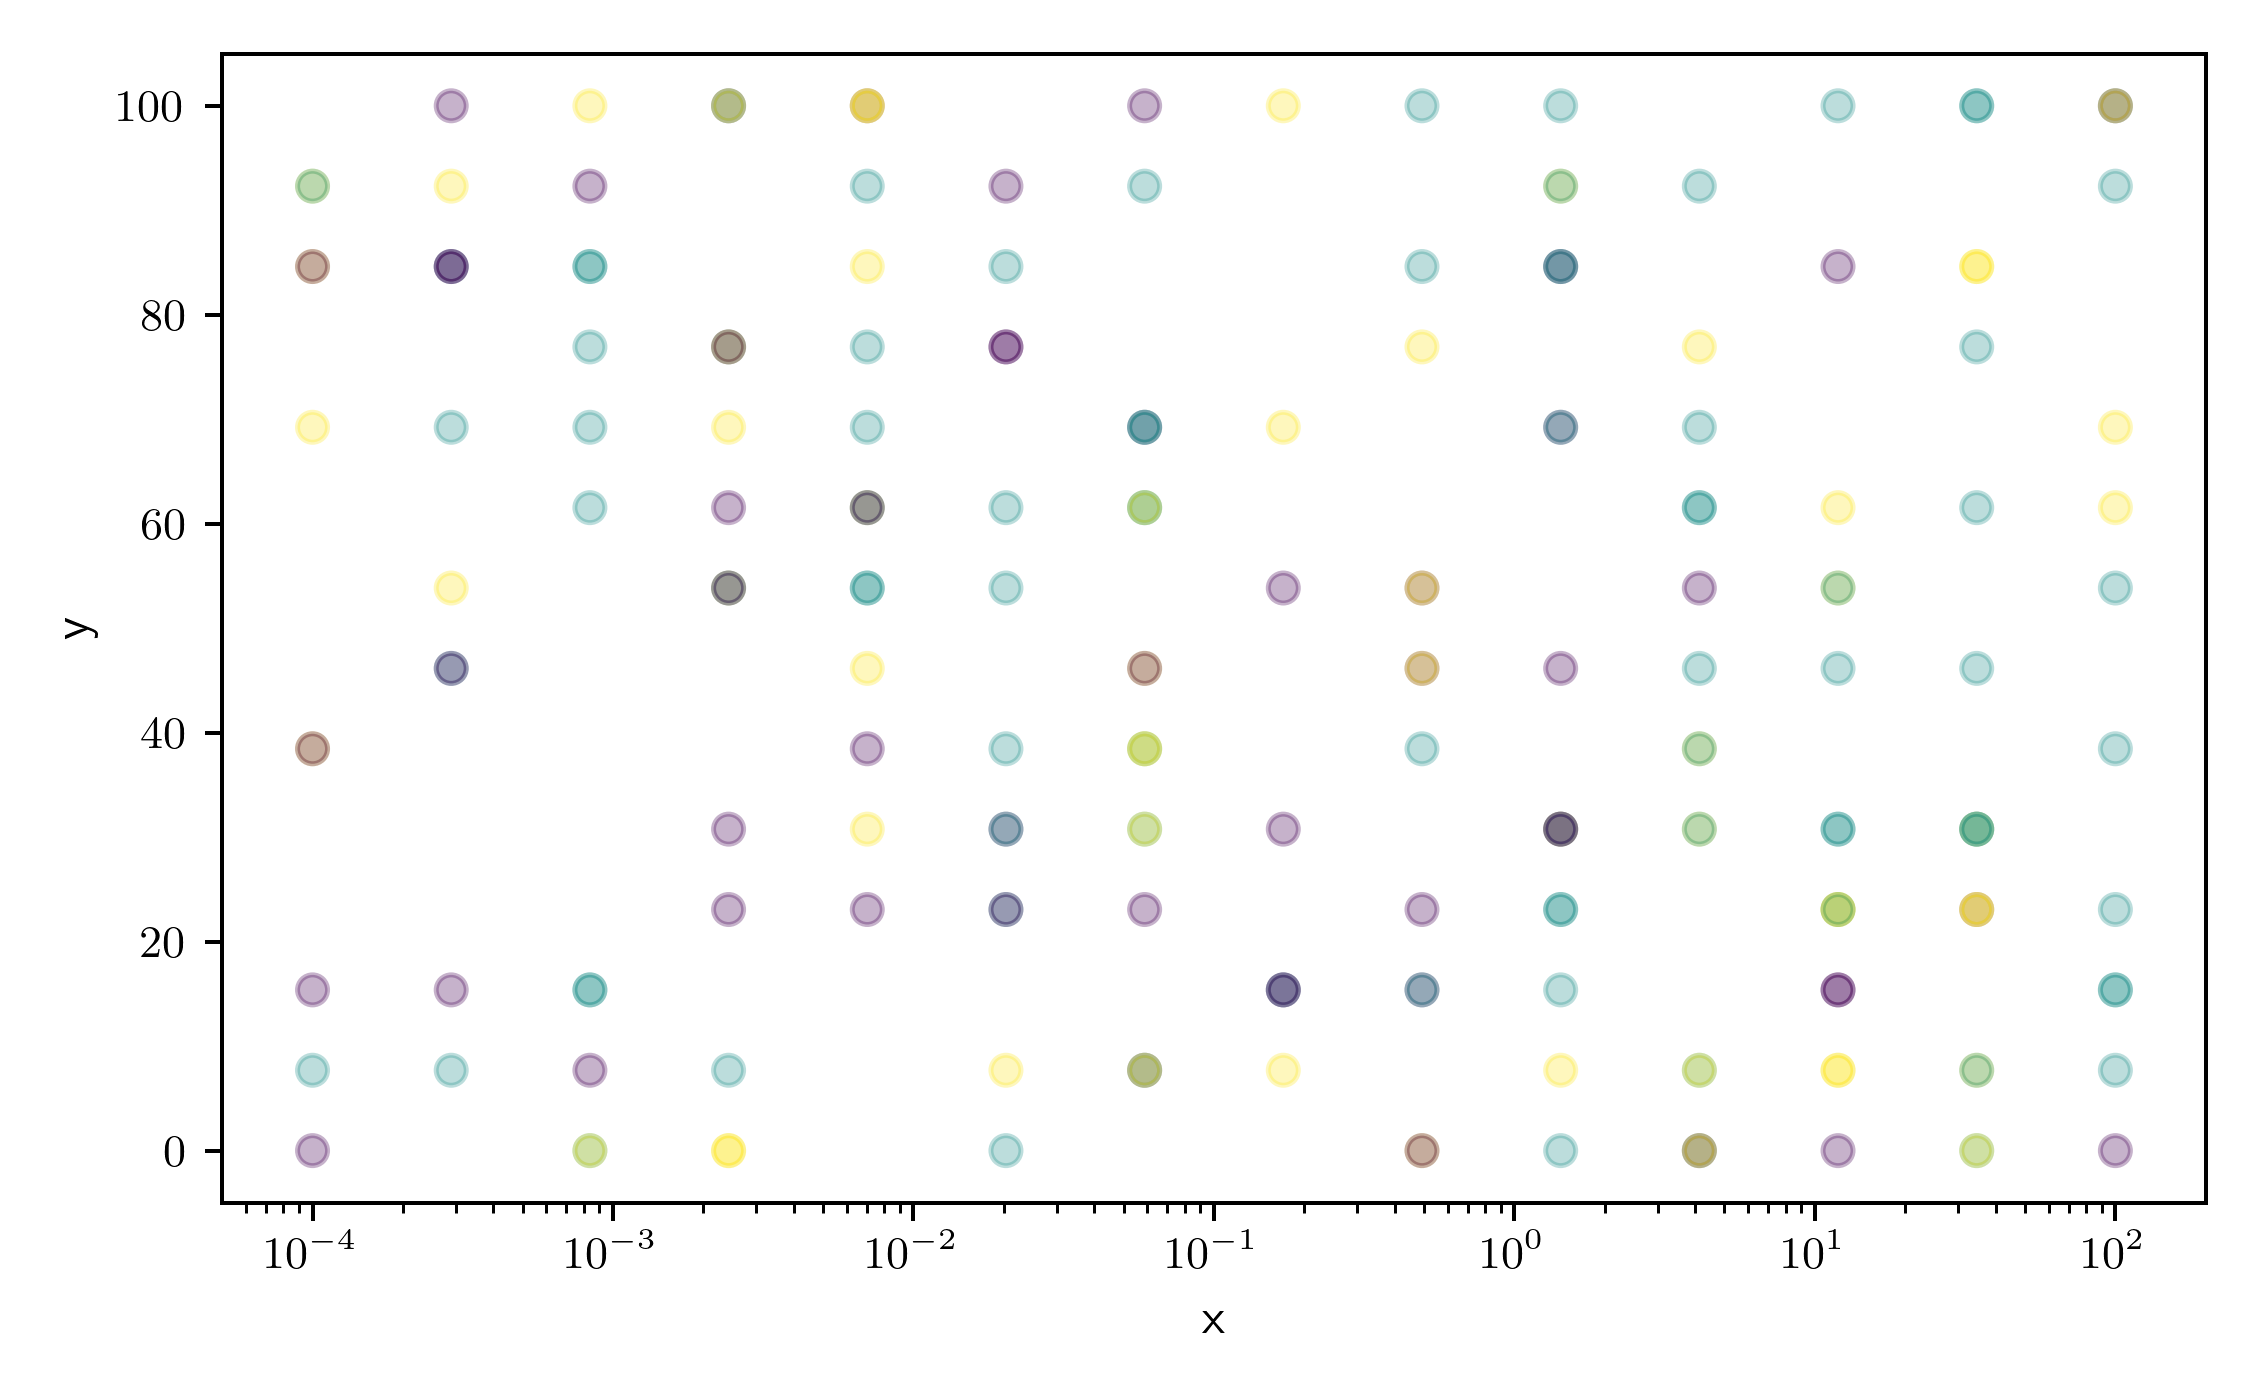
Finally, we plot the results from the collected DataFrame.
import matplotlib.pyplot as plt


fig, ax = plt.subplots()
ax.scatter(results["p:x"], results["p:y"], c=results["p:z"], alpha=0.3)
ax.set_xscale("log")
plt.xlabel("x")
plt.ylabel("y")
plt.show()
Total running time of the script: (0 minutes 3.929 seconds)