
Note
Go to the end to download the full example code.
Generating Combinations of Parameters for Standard Experimental Designs#
Author(s): Romain Egele.
This example demonstrates how to evaluate parameters following standard experimental designs such as random design, factorial design (a.k.a., grid search) and quasi-monte-carlo designs (e.g., lhs, sobol).
More specifically in this example we will show factorial design.
See Design of experiments (Wikipedia) to learn more about this topic.
Code (Import statements)
import os
import shutil

import matplotlib.pyplot as plt

from deephyper.analysis._matplotlib import update_matplotlib_rc
from deephyper.hpo import HpProblem
from deephyper.hpo import ExperimentalDesignSearch


update_matplotlib_rc()
We start by defining the search space of parameters. For the purpose of demonstration, we will define three variables of different “types”:
x: is a real parameter drawn from a Log Uniform distribution in order to uniformly draw small and large values from the defined range of values. Otherwise we would have low probability of testing values near the lower-bound.
y: is a discrete parameter drawn from a Uniform distribution. The discrete type is infered from the Python type of the bounds int.
z: is a categorical ordinal parameter.
problem = HpProblem()
problem.add_hyperparameter((0.0001, 100.0, "log-uniform"), "x")
problem.add_hyperparameter((0, 100), "y")
problem.add_hyperparameter([1, 2, 3], "z")
problem
Configuration space object:
  Hyperparameters:
    x, Type: UniformFloat, Range: [0.0001, 100.0], Default: 0.1, on log-scale
    y, Type: UniformInteger, Range: [0, 100], Default: 50
    z, Type: Ordinal, Sequence: {1, 2, 3}, Default: 1
We define the black-box function that we want to evaluate with these parameters.
def run(job):
    objective = job.parameters["x"] + job.parameters["y"] + job.parameters["z"]
    return objective
Code (Clean up legacy results)
log_dir = "eds_logs"
if os.path.exists(log_dir):
    shutil.rmtree(log_dir)
Then, we define the search that will generate parameters. For standard experimental designs we use
the deephyper.hpo.ExperimentalDesignSearch class. For a grid search, we set design="grid".
It is good to note that the deephyper.evaluator.Evaluator can also be used with this class to parallelize evaluations.
Also, it is important to set n_points and max_evals to the same value.
max_evals = 200
search = ExperimentalDesignSearch(
    problem,
    n_points=max_evals,
    design="grid",
    log_dir=log_dir,
)
results = search.search(run, max_evals)
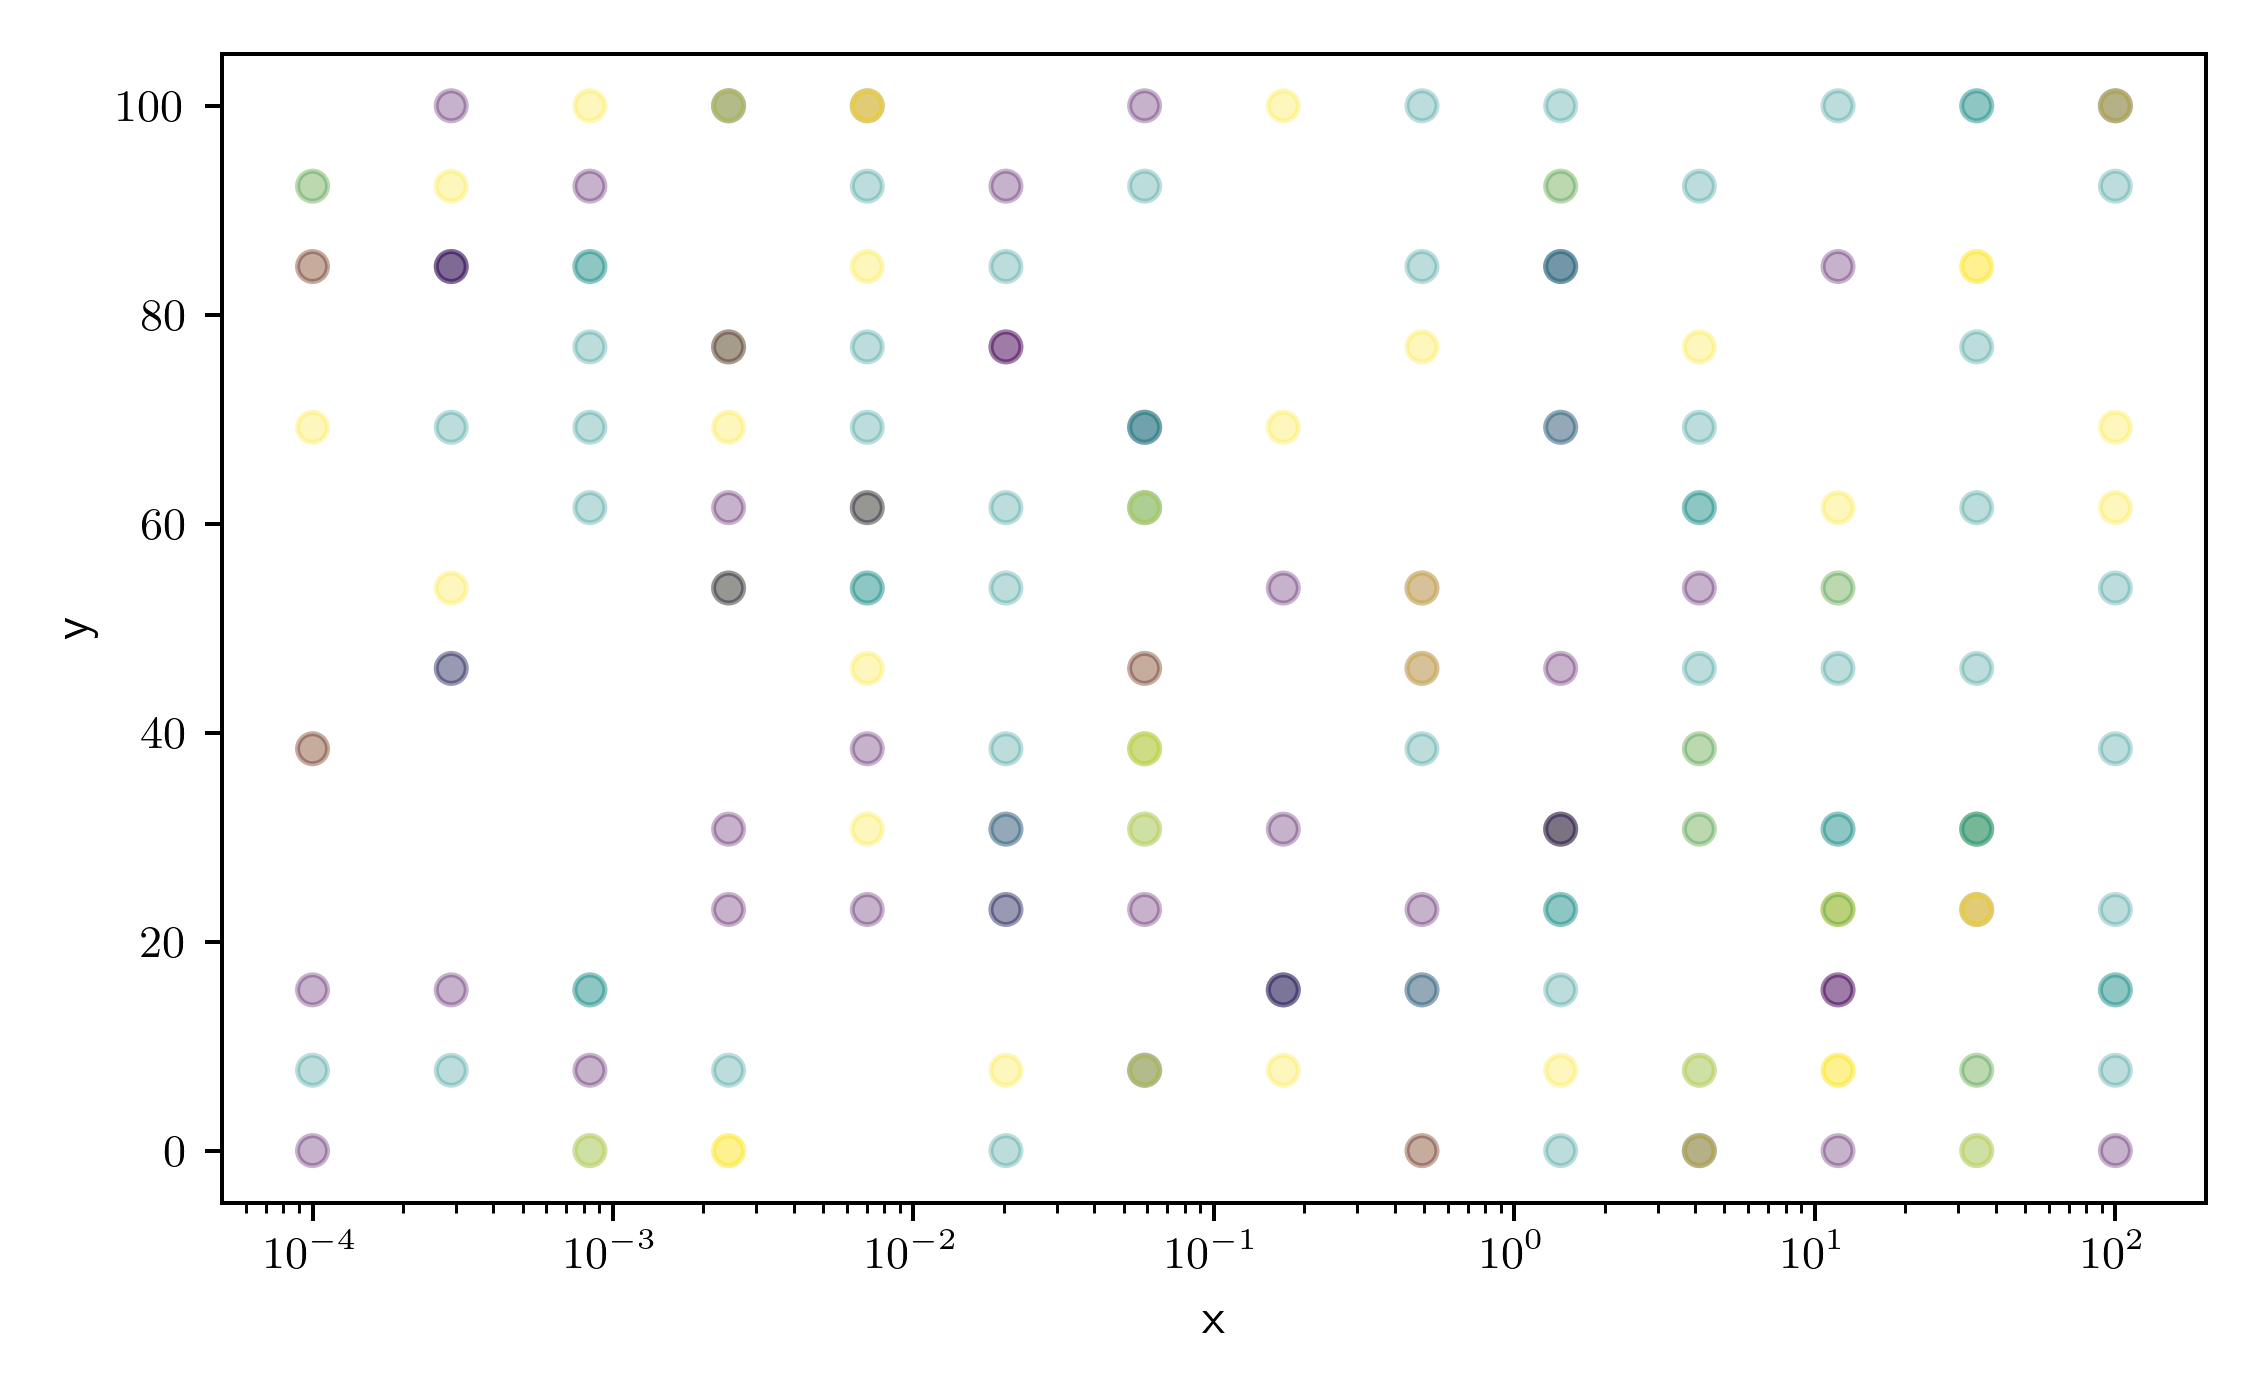
Finally, we plot the results from the collected DataFrame.
Code (Make plot)
fig, ax = plt.subplots()
ax.scatter(results["p:x"], results["p:y"], c=results["p:z"], alpha=0.3)
ax.set_xscale("log")
_ = plt.xlabel("x")
_ = plt.ylabel("y")
Total running time of the script: (0 minutes 3.086 seconds)